

[title]
Following last weekend’s severe thunderstorms, we all saw how vulnerable some areas of London are to flash flooding. Residents of Walthamstow, Hackney Wick and Camberwell found stations submerged and local roads turned into rivers.
But was Sunday’s flooding a worrying warning of things to come? Climate forecaster Climate Central reports that things could become much, much worse. Should we not cut greenhouse gas emissions and slow global warming, far more of London could find itself regularly underwater by 2030.
Greenhouse gas emissions warm the Earth’s atmosphere, melting the ice caps and raising sea levels. But a warmer atmosphere also makes adverse weather events – such as flash floods – more likely.
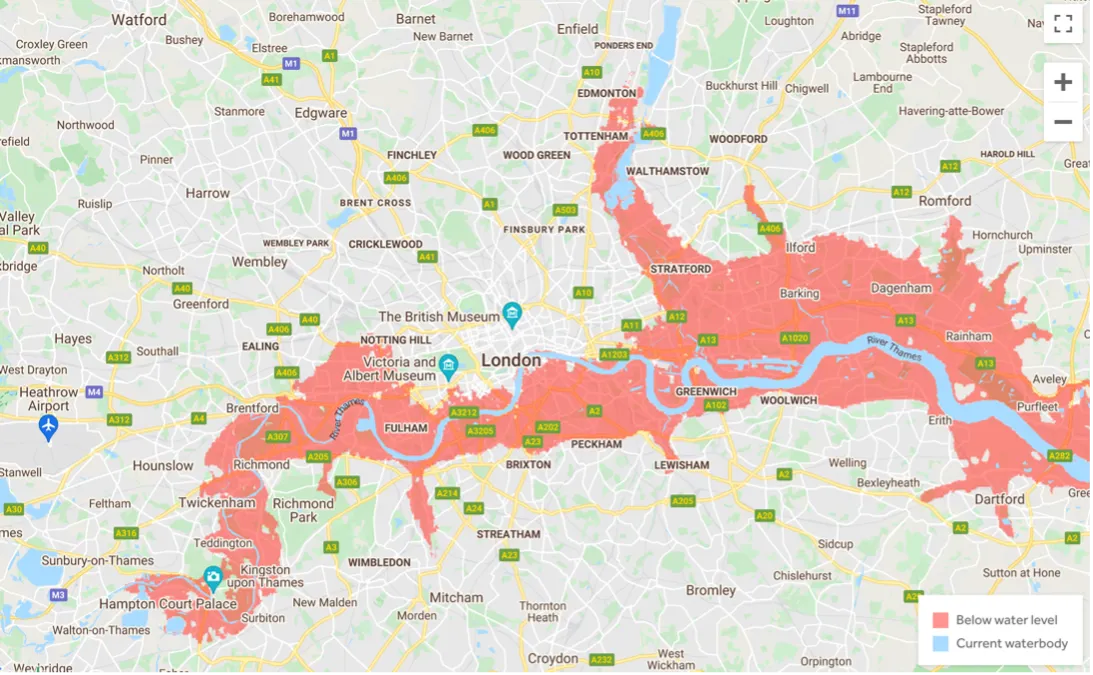
Climate Central’s maps show the combined effect of both sea-level rise and flooding, using red to show areas under threat. For millions of Londoners, it’s a pretty bleak picture.
West London
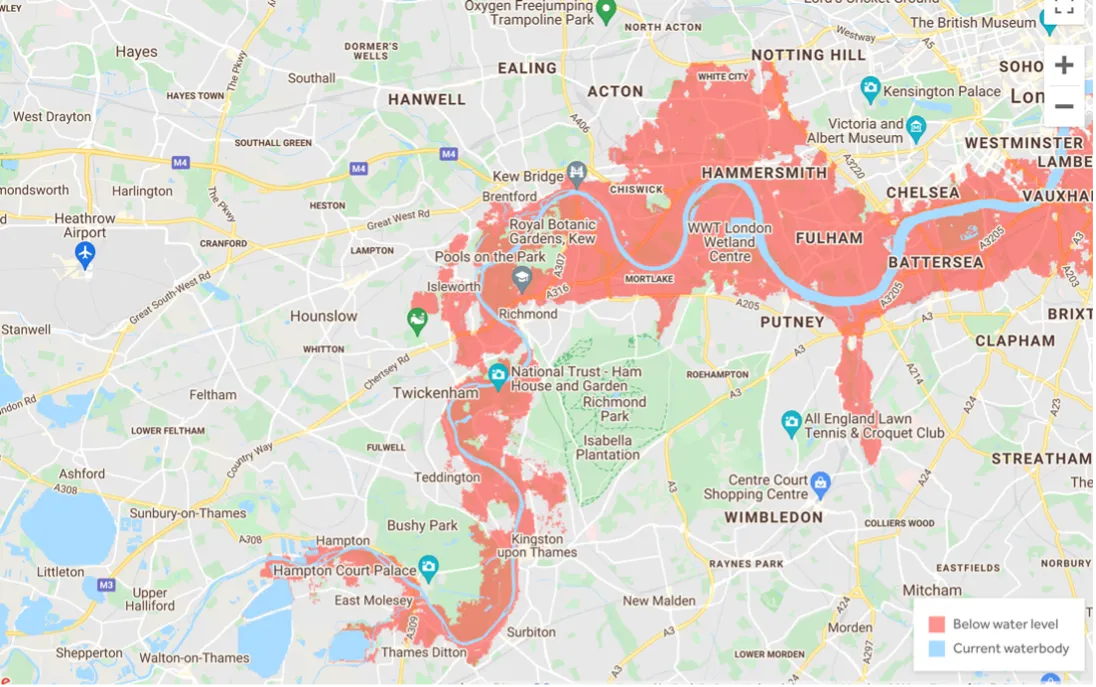
By 2030, most of east Twickenham, Chiswick, Hammersmith and Fulham are covered in red – as well as Westfield White City and much of Kew’s Royal Botanic Gardens.
East London
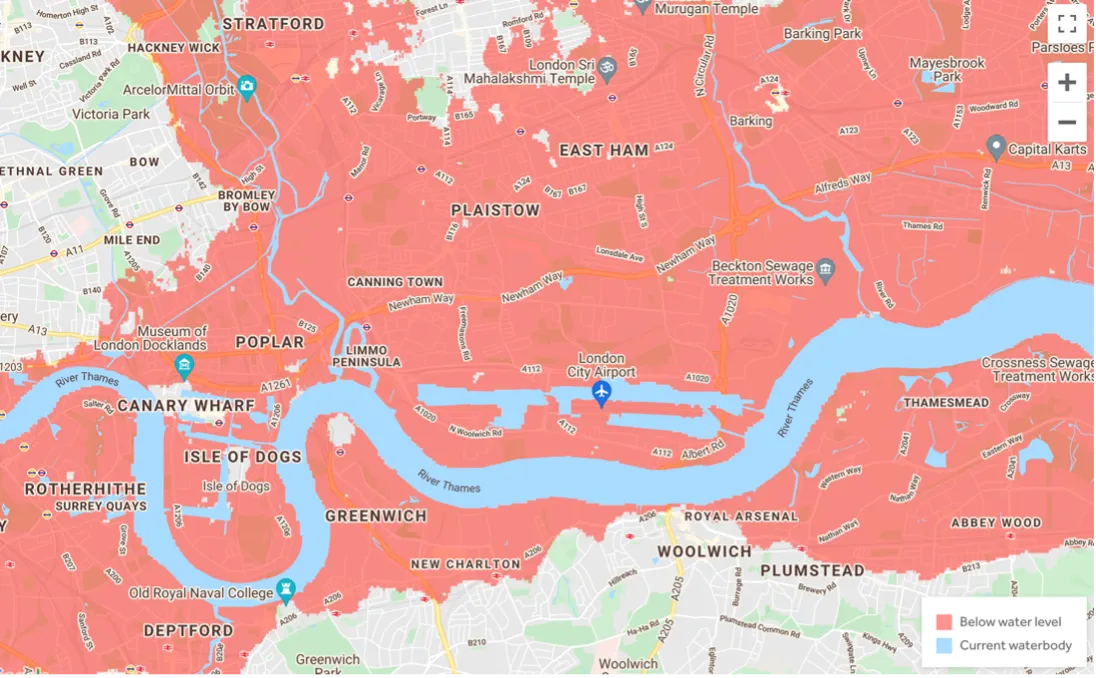
With much of East London lying on low ground, almost the entire area could find itself prone to flooding and sea-level rises.
South London
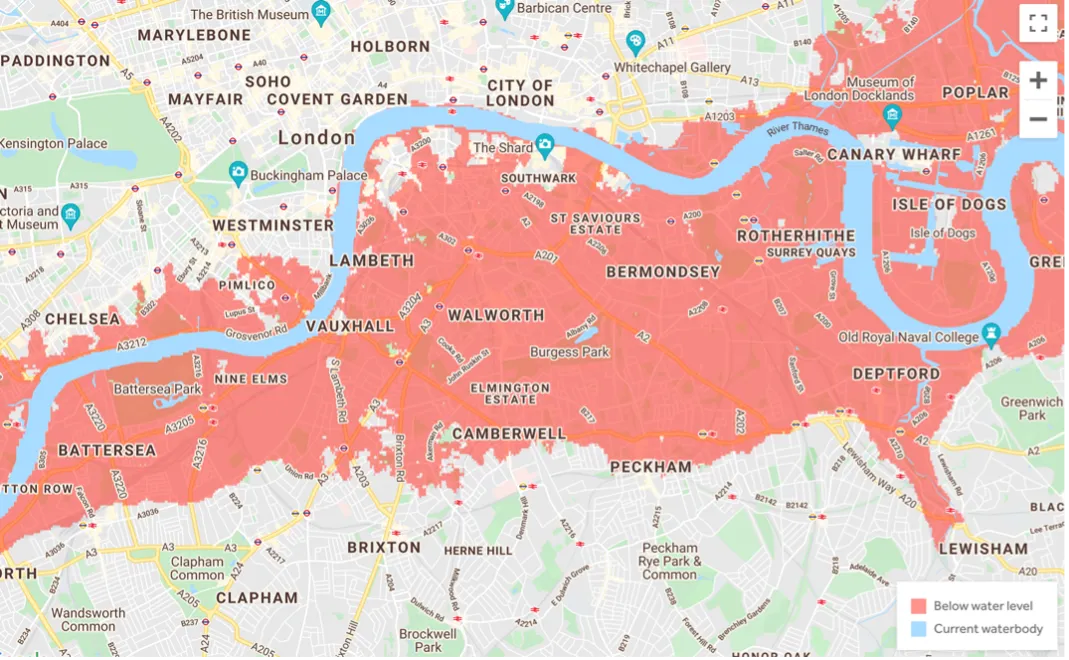
Like the east, a lot of the land south of the river is low and flat. From Battersea to Deptford, Southwark to Peckham, there might not be much more than open water.
North London
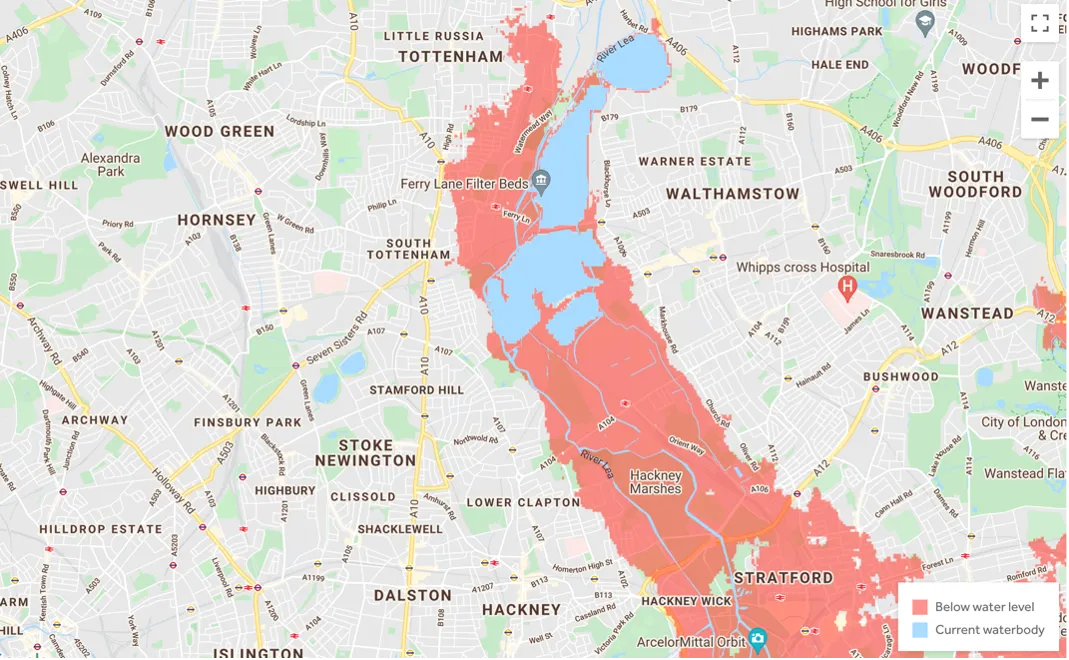
Particularly around the River Lee, Hackney Marshes and Walthamstow reservoirs, the map shows red creeping up the banks and submerging parts of Tottenham and Lee Valley.
Climate Central’s interactive map also lets viewers change the variables, allowing for different levels of pollution, flooding and even luck. Just out of interest, its absolute worst case scenario for 2100 (with ‘unchecked pollution’, ‘moderate’ flooding and ‘bad luck’) sees the capital looking something like this:
London flooding: this website will tell you if you’re at risk.